When I was asked to “illustrate the Carbon cycle” for a brochure on gardening and carbon use, by Riksforbundet Svensk Tradgard I wasn’t too perturbed. Easy enough. Four little words. How wrong I was!
Overview of the Carbon Cycle
Reduced to its simplest form, the Carbon cycle describes the flow of Carbon, and the gas Carbon dioxide, through the organic processes that happen in our world.
The Oxford English dictionary definition of the Carbon cycle is, “The movement of carbon through the surface, interior, and atmosphere of the Earth. Carbon exists in atmospheric gases, in dissolved ions in the hydrosphere, and in solids as a major component of organic matter and sedimentary rocks.” So we’re already looking at Carbon in the air, in earth, in rocks, and in water. As ions in solid and gas form. Maybe that illustration won’t be so straight-forward after all.

Early thumbnail sketch trying to incorporate the different elements of the Carbon cycle
When plants and animals die, they rot down, depositing carbon into the soil. This travels and seeps through the soil, and although some is used by micro-organisms, fungal hyphae, and roots in the soil; some turns into sedimentary rocks. Over time, some will be compressed and form fossil fuels.
Now we need to introduce Carbon dioxide, a gas, into the cycle. This is exhaled by animals, both below the soil on a microscopic scale, and on land (and in water and air), on microscopic and macroscopic scale. Carbon dioxide (CO2) is used in photosynthesis. This image is getting complicated.
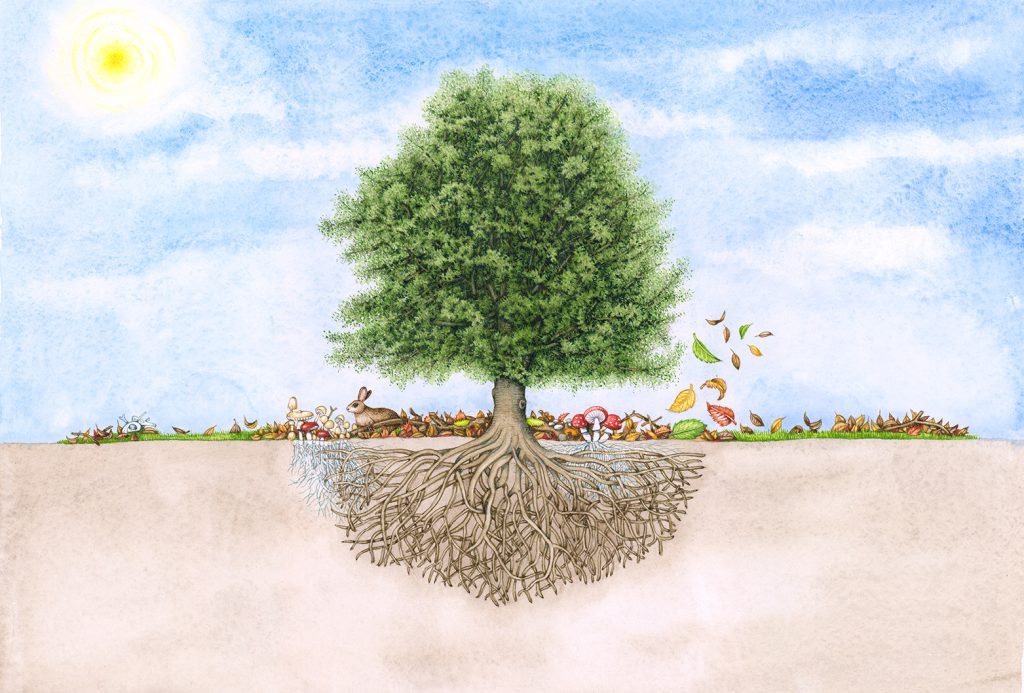
Completed tree with roots, fungal hyphae, and leaf litter. No gas clouds added…yet
The Carbon cycle and Photosynthesis and Cellular Respiration
An extra and vital step in the Carbon cycle is the role of both photosynthesis, and respiration. Photosynthesis occurs within green leaves and produces sugar and Oxygen in sunlight, created from water and Carbon dioxide. Respiration is practised by all living organisms (including plants) and is almost a reversal of photosynthesis. Oxygen and sugar are broken down to release ATP (whose purpose is defined in the Encyclopedia Britannica as, “ATP captures chemical energy obtained from the breakdown of food molecules and releases it to fuel other cellular processes.”) By-products are CO2, and water.
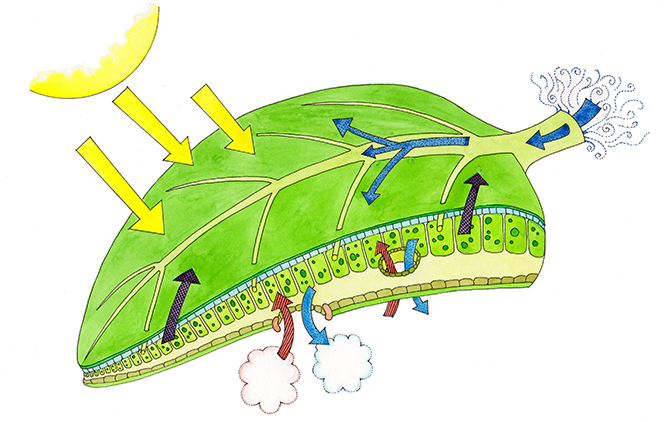
Diagram showing the process of photosynthesis (purple arrows are glucose, red arrows CO2, pale blue arrows O2 and dark blue arrows show water)
Perhaps an easier way of showing photosynthesis is using an entire plant? At this stage, I’m wondering how to streamline the cycle and manage to show all the elements involved. Looking at work I’ve done in the past for other jobs (like this leaf and plant diagram) is really helpful, although provides no instant solution to the challenge.
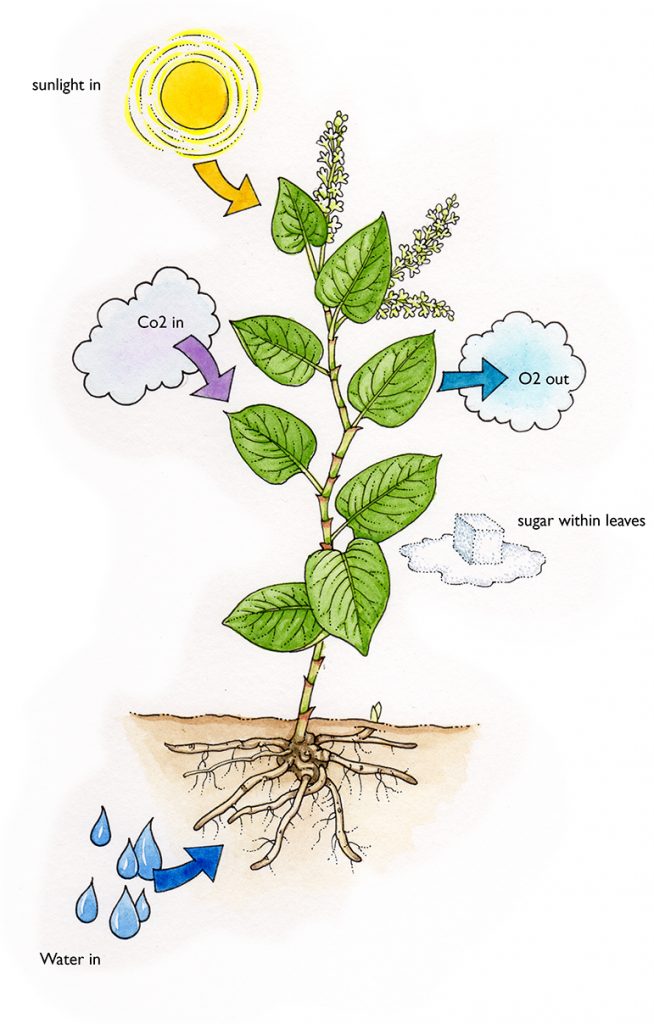
Annotated Photosynthesis diagram using the Japanese Knotweed
Untangling the steps of the Cycle
Having got my head round what needs including, I have to decide the best way to do this.
I want the entire illustration to be more or less cyclical, although it’s not as clean-cut as perhaps an illustration of the water cycle might be. So the central image needs to be a tree. Let’s make it stately, with plenty of room under the soil for roots, and enough of a canopy above to give space to include information on photosynthesis and respiration. I illustrated a tree which will provide the perfect scaffold for the cycle last year.
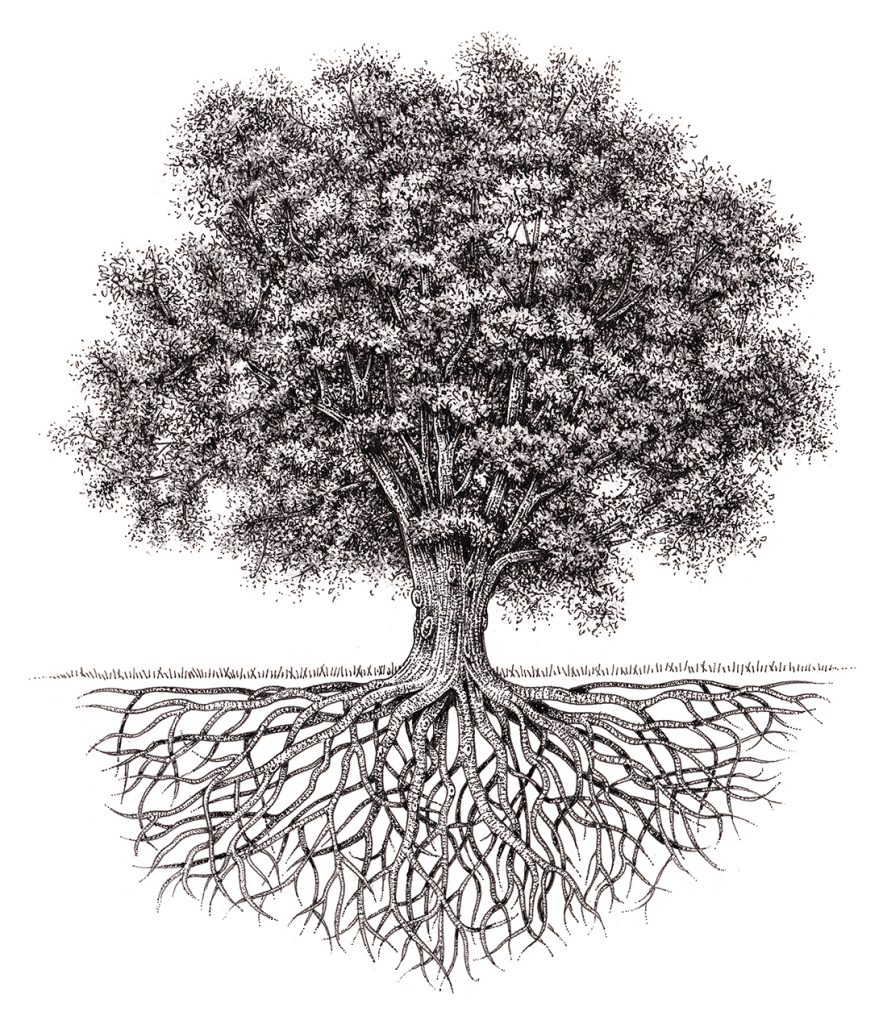
White Oak Quercus alba with stylized root system
Other images can be shown as vignettes. It’s important to make this picture visually pleasing as well as comprehensible, so I’ll balance the vignettes. One on either side below the soil. A mirrored pair at soil level. And two overlaid on the tree canopy. Sounds like a plan.
Vignettes: Below the soil: Micro-organisms
One shows soil micro-organisms. These use Carbon from the tree and the soil to build themselves. They also release Carbon when they die, and as CO2 from respiration. Organisms living in the soil like this are often tiny, and can be simplified to six main groups. Bacteria, virus, algae, fungi, protists, and nematodes. It goes without saying that there is vast variety in each group, and these vary from habitat to habitat.
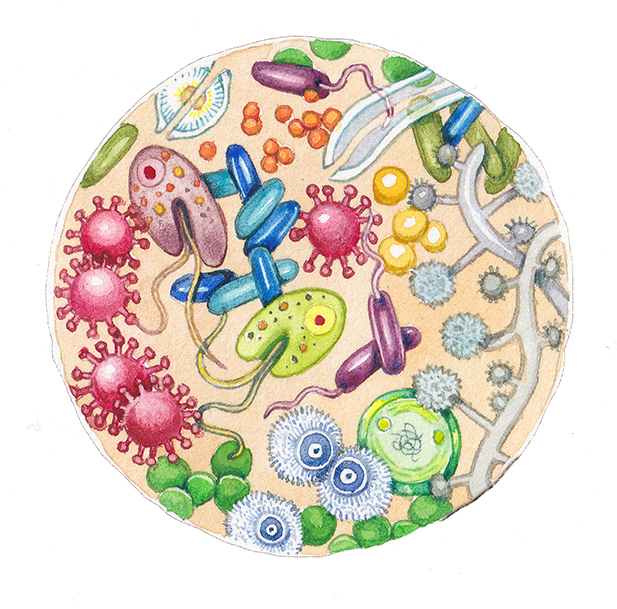
Micro-organisms in the soil
So I show a simplified representative of each. The virus look like spiky balls. Bacteria are spherical or rod-shaped. The fluffy spores and hyphae on the right represent fungus. Protists are shown by the flagellates in the centre. Algae are represented by the diatom at the top left and the volvox-like organism by the hyphae. Wriggling behind, we have the head end of a nematode worm.
Vignettes: Below the soil: Roots
The sister vignette on the opposite side shows a close-up of a root-tip. It grows (using Carbon), practises respiration (producing CO2) and dies (releasing Carbon). I can’t really show it dying in such a small space. I’m hoping accompanying text will cover this. The root tip cells which slough off should suggest this senescence, if the viewer knows about root anatomy. Each root cell has a cellulose cell wall, a central space or vacuole, and cytoplasm around the edge. In truth this is a gross simplification. Cells in the root tip can become Parenchyma cells, which absorb and carry nutrients. Or they can be Sclerencyma cells, which form the cell wall. In the cytoplasmic matrix are all the cell’s organelles, along with a nucleus.
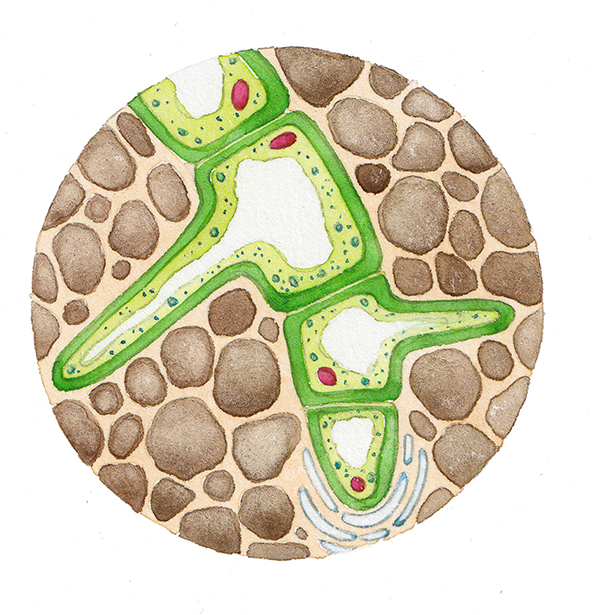
Cellular image of a root tip
The lateral projections are tiny root hairs. These increase the surface area of the root, and allow for absorption of water and nutrients from the surrounding soil.
At the tip of the root you find the root cap. This area is vital to plants. Information as to gravitational and growth response occurs here, along with responses to different external environmental stimuli. The root cap also protects the growing meristem cells. Root cap cells are short-lived, being sloughed off and destroyed as they nose their way through tough soil particles. In the root cap you also have acidic hydrogen ions. These break down the soil chemically, which allows minerals and nutrients to be absorbed by the root hairs. For more on the structure of root tips, please visit the ehow site, or this overview from the Journal of Experimental Biology (June 2015, Kumf and Nowak).
Vignettes at Soil level: Detritovores
Mirrored vignettes at soil level show detritovores which break down Carbon from fallen leaves and twigs. These are just flipped around the central axis of the tree trunk. The creatures in this assemblage also breathe, exhaling CO2. When they die, they release Carbon back into the soil. And, of course, they use Carbon in the soil to build and grow themselves.
This is my favourite part of the illustration. I get to cram lots of delicious invertebrates into this vignette. Despite my best efforts, this illustration only touches the surface of the animals that make their home in the leaf litter and surface layers of soil. As before, it’s grossly simplified. Every habitat, in fact every plant, may have a different assemblage of detritovores associated with it. This activity from Scientific American tells you how to see what decomposers are in your local patch of leaf litter.
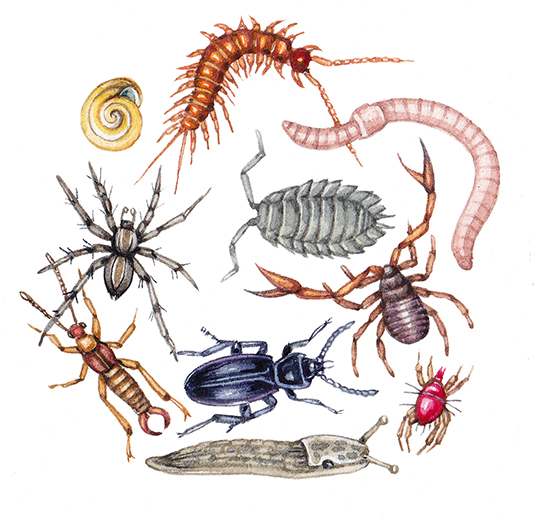
Detritovores in the leaf litter
Representatives I include here are based on invertebrates I find most often when scrabbling about in leaf litter. And ones I love illustrating. So there are snails and slugs. Spiders and mites. We have a woodlouse (I love woodlice as they carry their developing young around with them, slung in a brood pouch). And an earthworm. I could have included another Nematode, but the scale made it tricky. We have ground beetles, some of whom are ferocious predators, capable of slicing a slug in half with one snip of their mandibles.
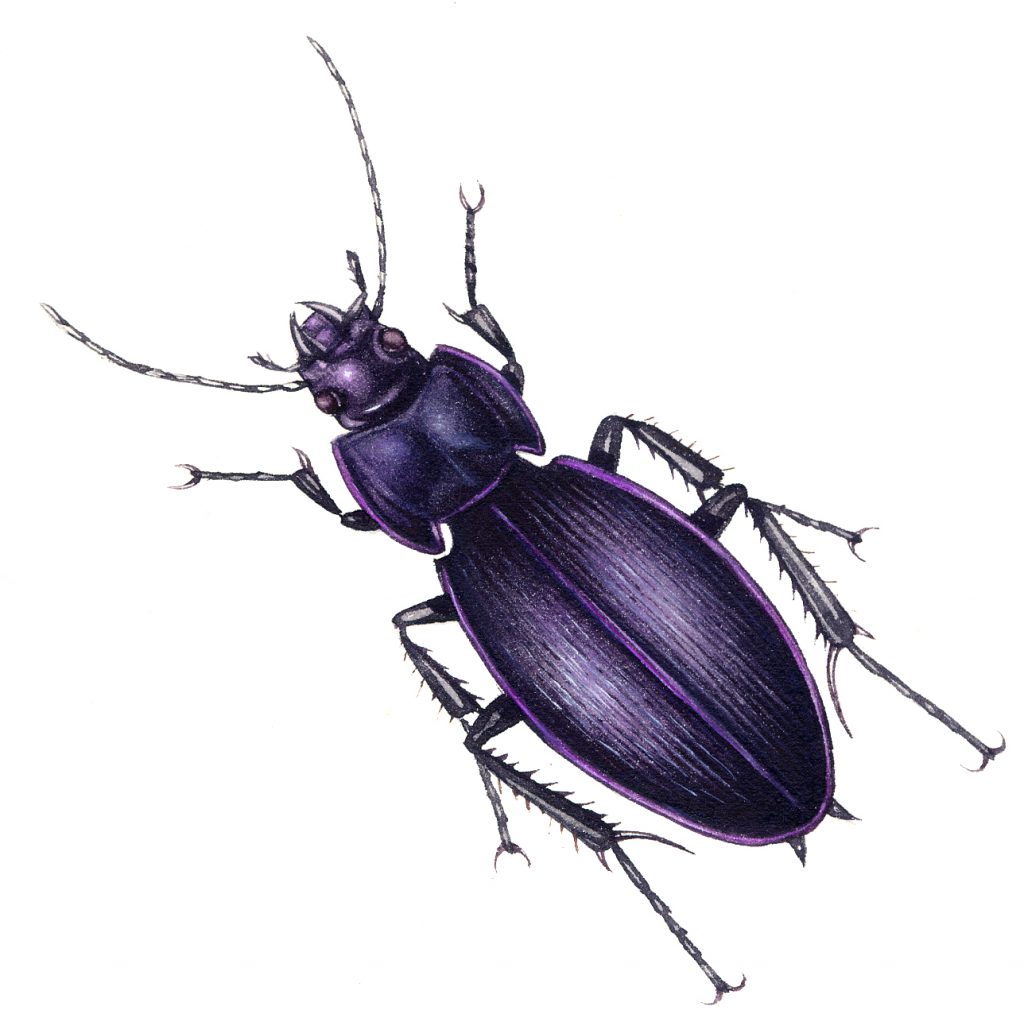
Earwigs scuttle about, as do the remarkable Psedoscorpions. There are millipedes and centipedes.
Detritovores that don’t get included
As with all of these vignettes, it has to be simplified. Remember in fact that even within this assemblage you have herbivores (like the millipede) and carnivores (like the centipede). Hunters (like the ground beetle and spider) and prey (the slug). You even have parasitic relationships going on, with mites exploiting ground beetles.
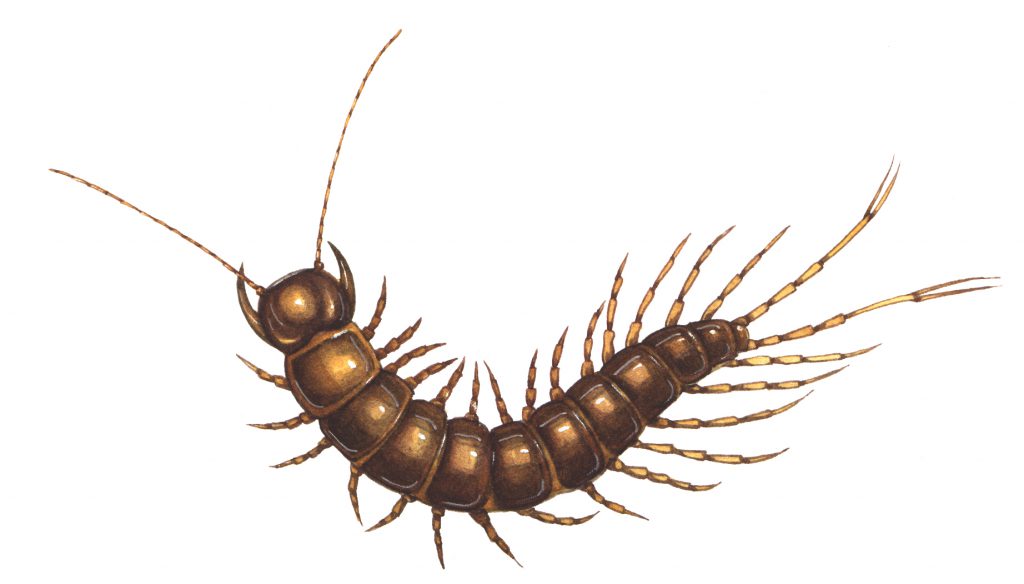
Centipede
Some sources, such as Frontiers, prefer to show the leaf litter as a cycle in its own right. This makes sense, especially when we remember that there are the same micro-organisms at play in the leaf litter, along with fungal and tree activity.
Lots of fabulous invertebrates, like springtails, thrips and ants, failed to make the cut. For an overview on detritovores by the Biology dictionary, click here.
Soil level: The importance of fungus
At soil level, other things need to be included if we’re going to see the Carbon cycle as a whole. Fungus is front and centre. It’s only comparatively recently that the intense and vital relationship between roots of plants and of fungus is coming into view. Brilliant books like “Entangled Life” by Merlin Sheldrake have popularised it, and we’re now realising that fungus plays a massive role in allowing communities of trees and other plants to communicate at a sub-soil level.
Irrelevant of communication, fungus are also indispensable to the carbon cycle. Their hyphae spread out under the soil, going massively further than the surface-level fruiting bodies might suggest.
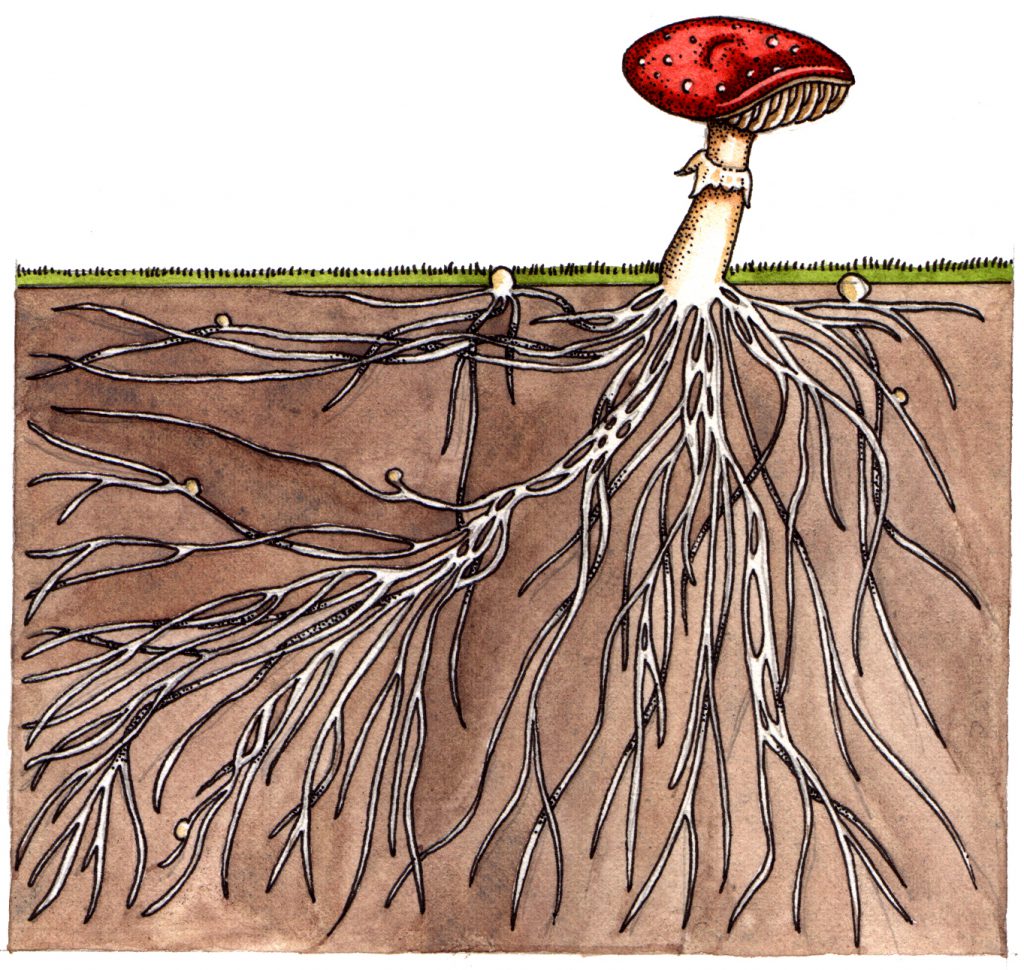
Fungus with hyphae diagram
These mycelium break down wood and other organic matter. They can also store and disperse these nutrients. At this point in my research I also clocked that, if I was going to do this right, I ought to tie in the Nitrogen and Phosphorous cycles. But you have to draw a line somewhere! Mycelium move Carbon and other nutrients cover vast networks, using them for their own growth and delivering them to plant roots. It’s well understood that plant and fungal roots are symbionts. For more on how these sharing networks can be studies, check out “The role of wood decay fungi in the carbon and nitrogen dynamics of the forest floor” by Watkinson, Bebber et al (2009)
Fungus in my Carbon cycle illustration
I choose a few representative fungal species I see often in leaf litter. These include notorious wood rotting species like the Honey fungus Armillaria mellea, which attacks living as well as dead wood. There’s a representative Russula species, and a Shaggy Ink cap Coprinus comatus.
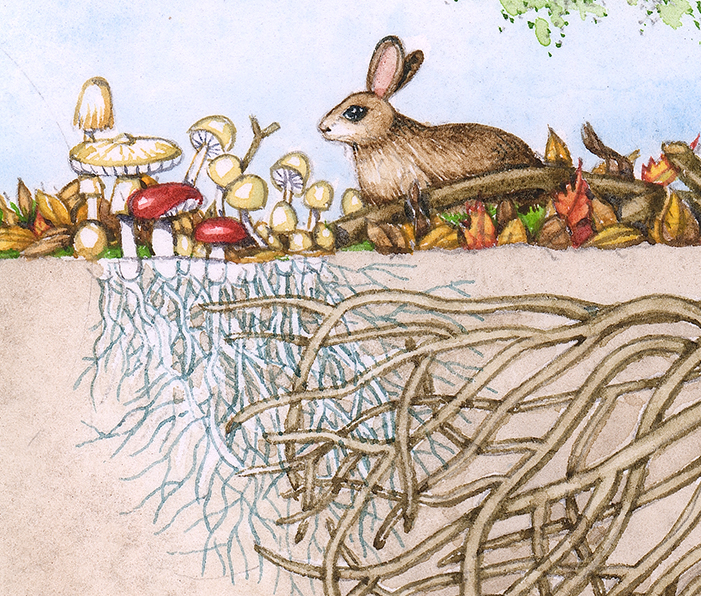
Fungus in the Carbon cycle
I also include the Fly agaric (on the opposite side of the illustration), because it’s so instantly recognizable as “fungi”. This is disingenuous. Agarics have lost the enzymes needed to decompose leaf litter, and are wholly reliant on their tree hosts for nutrients. With the network or entangled roots described above, they’re the epitome of a symbiotic relationship between tree and fungus. The fungus carry nutrients to the tree, the tree feeds the Fly agaric. (Read more on this on Woodlands.uk blog).
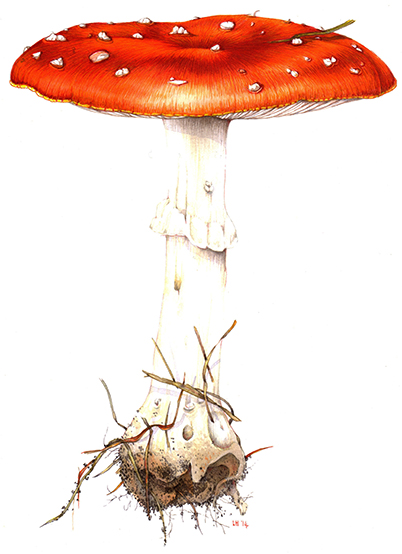
Fly agaric Amanita muscaria
I pop in some representative lichen. Lichen is a symbiotic organism, composed of algae and fungus (or cyanobacteria). Their role in the Carbon cycle is less as a decomposer, but more as a Nitrogen and Carbon fixer. They’re vital to both cycles, so need including, but on a diagram of this scale there’s no space to explain that rather than rotting down wood and leaves, they’re more important for their role as photosynthesizers. The same is true of the tufts of moss I include.
Soil level: Larger animals and death
Obviously, it’s not just the micro-organisms and invertebrates in the leaf litter that contribute to the Carbon cycle. Larger animals exhale CO2, and when they rot, they’re turned back into Carbon and basic nutrients by animals living in the leaf litter. Some specialised creatures, like the rather glorious Sexton beetles, have eveolved to fit this ecological niche. I choose a rabbit as my larger animal representative, and just the other side of a log, I add some bones to show how death and decay feed into the cycle.
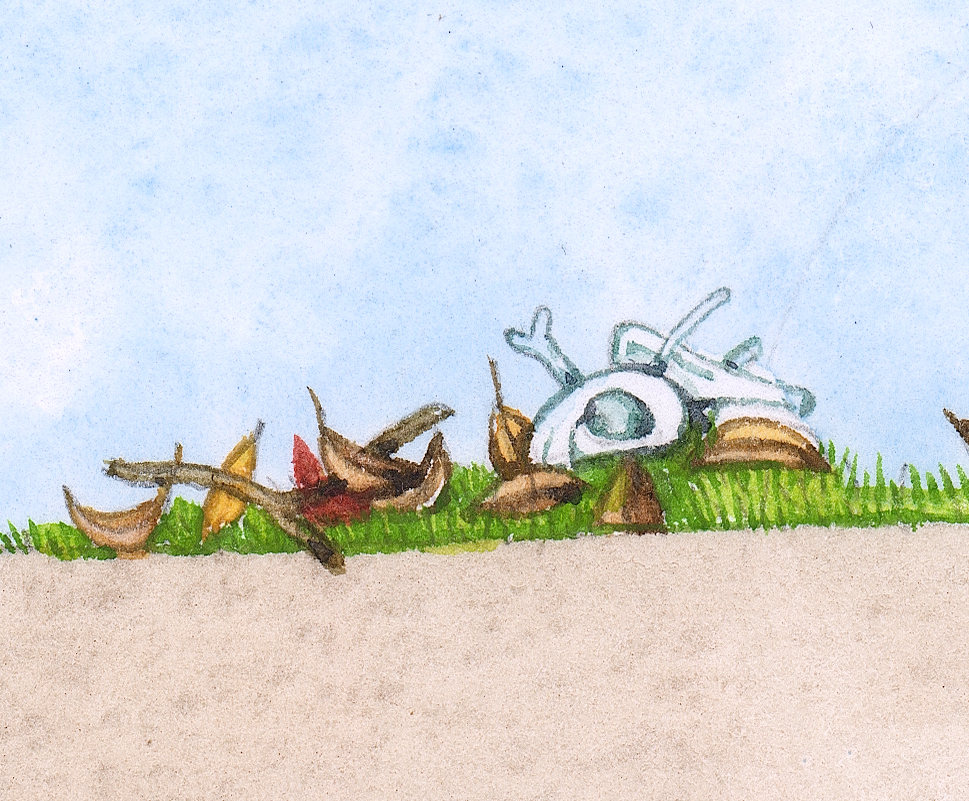
Bones
Soil level: Leaves
It’s self-evident, but probably worth mentioning that the main component of leaf litter is…leaves. There are twigs, branches, dead detritovores and a host of other goodies in leaf litter. But your main component are leaves. These need to be shown as they rot down, but also falling from the tree, bringing their own personal packet of Carbon to the ground.
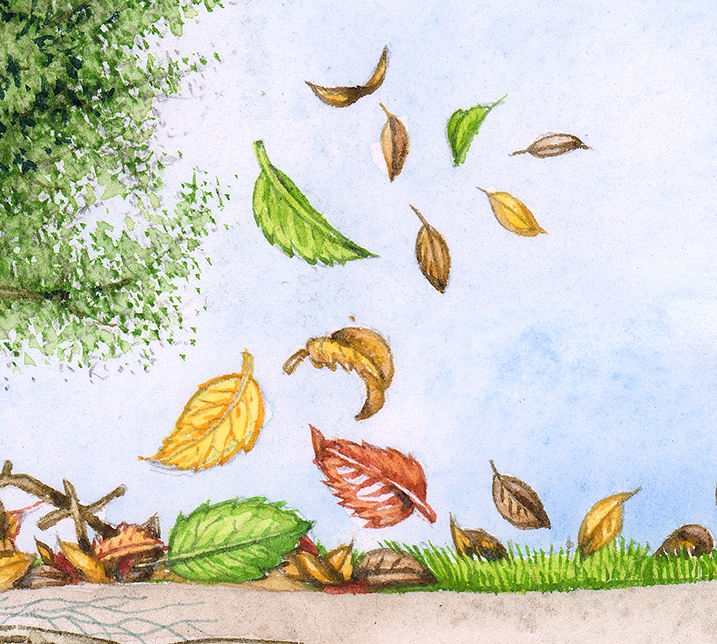
Falling leaves adding to the leaf litter layer
I include leaves from other species too, easily representing this in a simplified form by varying the leaf margins. I make some fresh and green, and others browned or yellowing, referring to the glut of carbon-rich leaves which fall every autumn.
Now, finally, we can cast our eyes upward.
Vignettes at Sky level: Photosynthesis and Respiration
I want to include visual information on Photosynthesis, but representing it in diagrammatic form proves tricky, and too complicated. This is also true of Respiration.
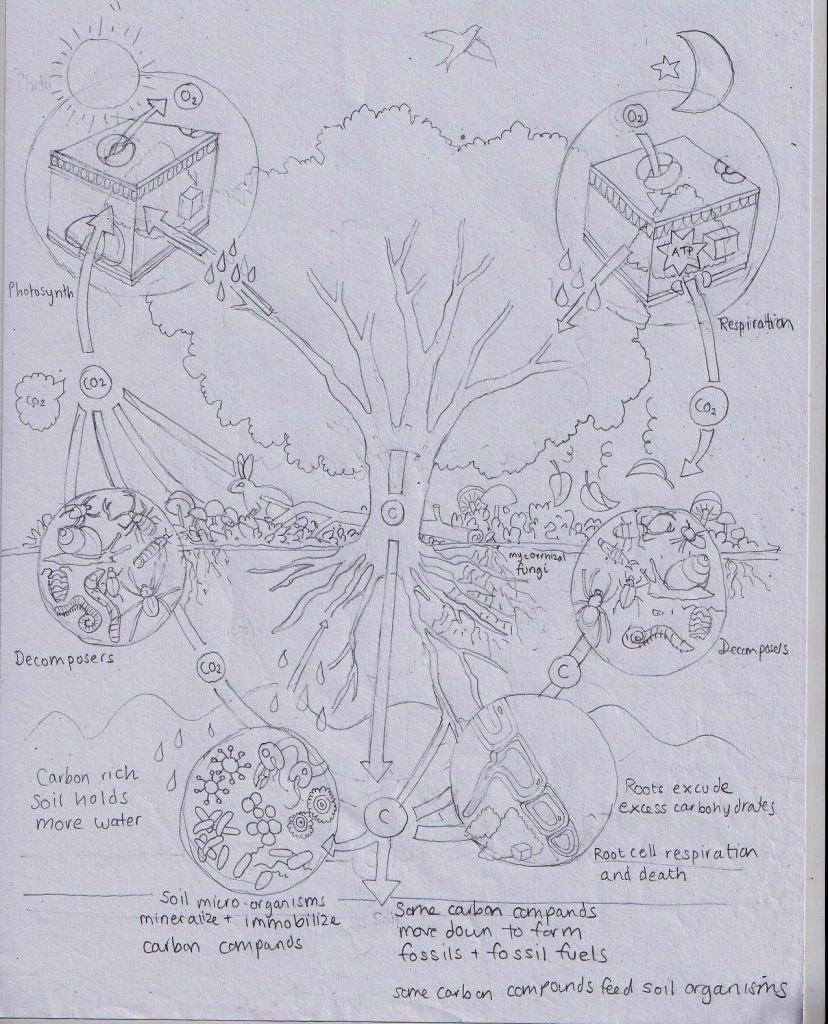
Initial Thumbnail rough Carbon cycle
I’m relieved when the client asks if we can replace the leaf cross sections you can see in the rough above with the equation for each process. However, I don’t want the space around each equation to feel dead, so I provide simplified motifs for Carbon dioxide, Oxygen, Sugars (C6 H12 O6), Water (H2O), and ATP.
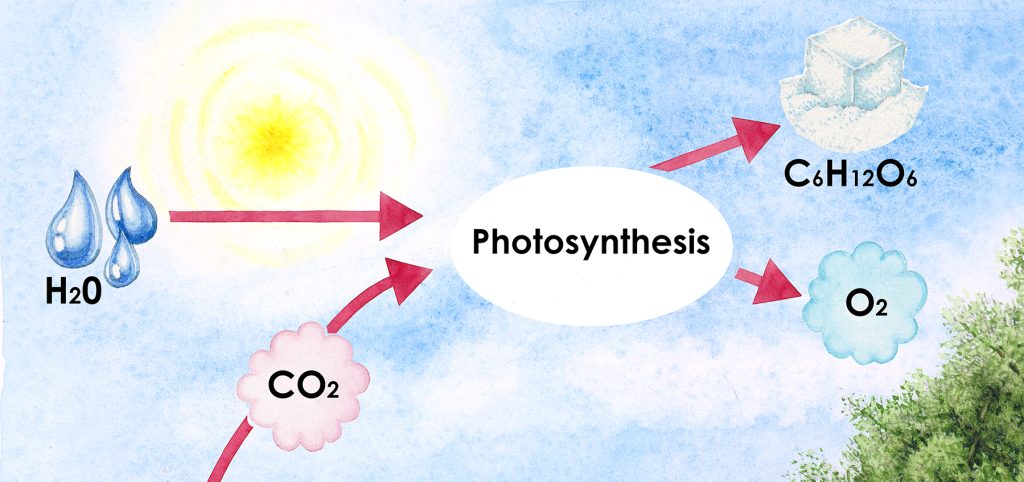
Simplifying photosynthesis
For the record, the equation for Photosynthesis, which occurs thanks to chlorophyll, in the presence of sunlight, is CO2 + H2O = O2 + C6 H12 O6 (glucose). Respiration, occurring in plants as well as animals, is O2 + C6H12O6 = H2O + CO2 +release of ATP. And no, I’m not tempted to get into the details of how turning ATP into ADP gives living organisms the energy they need to exist! If you want more on that chemical process, also known as Hydrolysis, find it here.
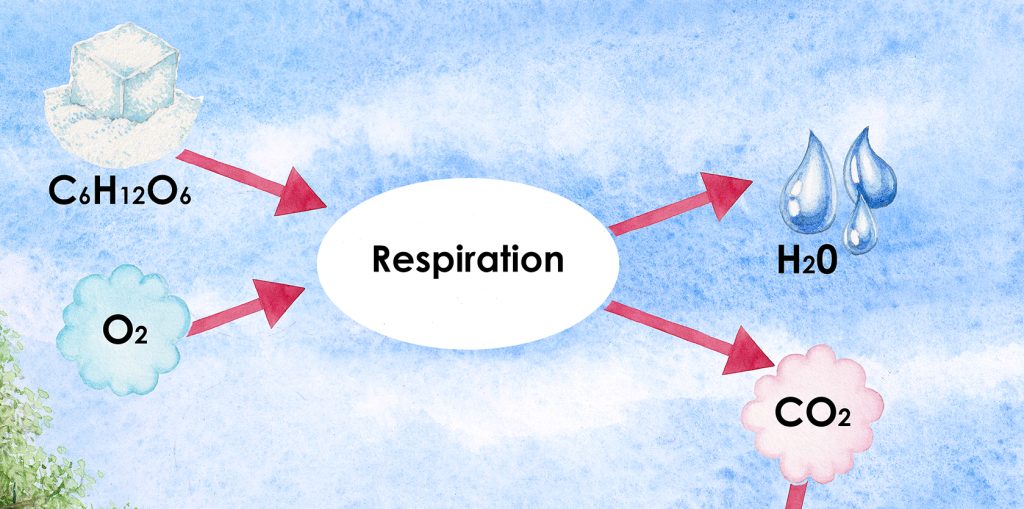
Simplifying respiration
The last thing that needs adding to the carbon cycle illustration is, oddly, a suggestion of day and night. This is because photosynthesis can only occur in the presence of sunlight. And, in most plants, respiration occurs mainly at night. I add a little sun above the Photosynthesis equation, and although I want to add a little moon above the respiration one, this is vetoed by the client.
Done.
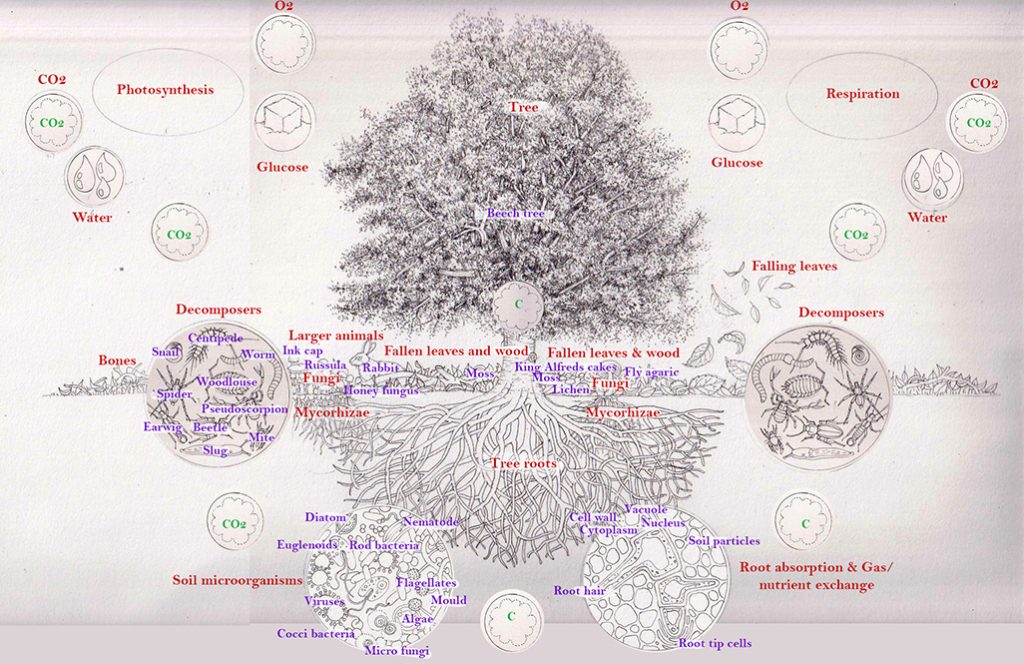
Annotated Carbon cycle illustration
Conclusion
So several rabbit holes and a whole lot of research later, I finish my Carbon cycle illustration. It’s too simple and doesn’t reflect the complexity of nature. It fails to reference the interactions between the Nitrogen, Phosphate and Carbon cycle. It doesn’t show the ongoing inter actions on a smaller scale, or how each living animal is exhaling CO2, and rotting down to Carbon after death. I’ve more or less left out the Carbon getting trapped in soil, and rocks. I’ve only given a superficial nod to the accumulation of carbon in the soil in rocks which get compressed to form fossil fuels And when I introduce arrows, I feel the whole image becomes more, rather than less complicated. But nature doesn’t keep to clean, proscriptive shapes; there are endless exchanges on a smaller level, and fascinating details like fungus, lichen, and insect parasitism to consider.
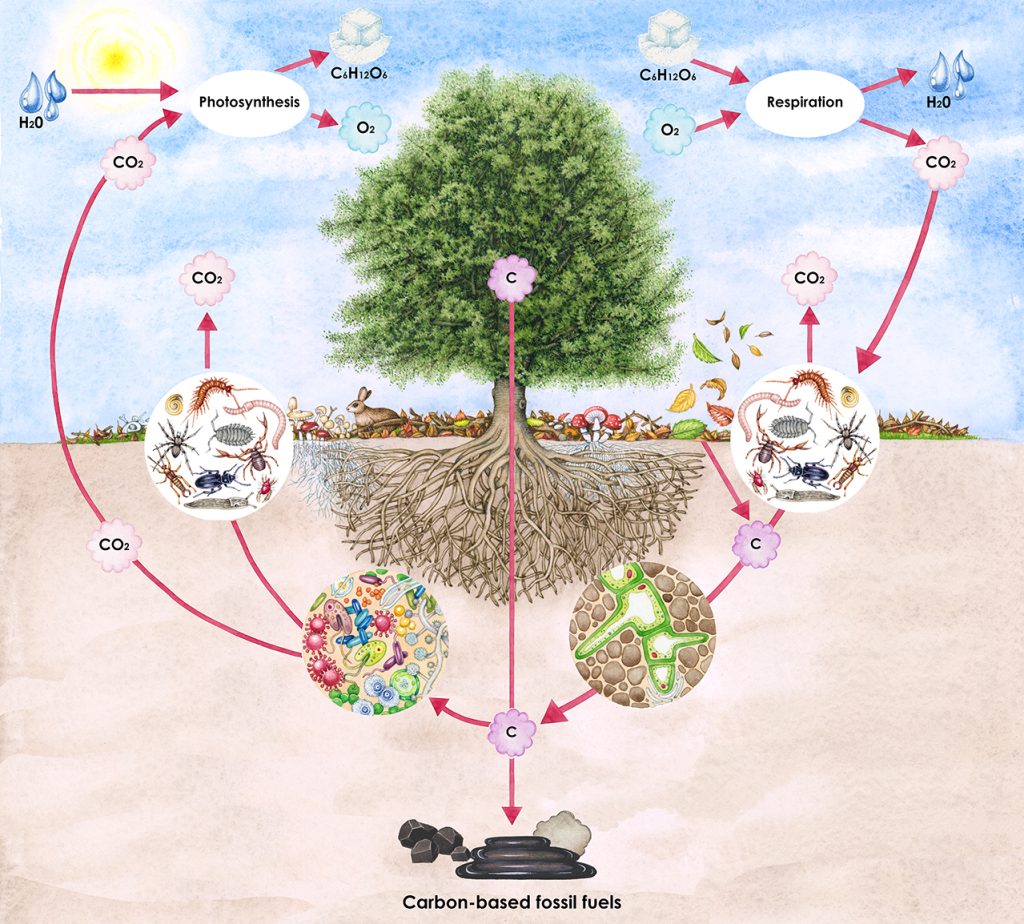
Finished and annotated carbon cycle
However, as an exploration and an illustration to accompany those four little words,. “illustrate the Carbon Cycle”? I think it’ll do.
And here it is, on the pages of the Tradgardens Klimatnytta brochure, produced by Riksforbundet Svensk Tradgard. The brochure will be published soon.
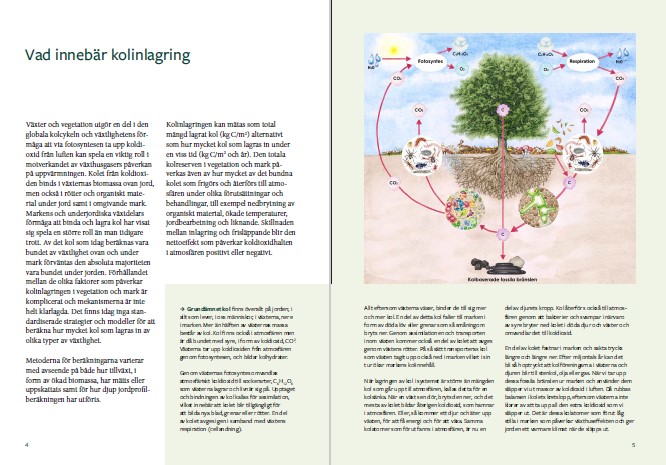
Carbon cycle page from the TRÄDGÅRDENS KLIMATNYTTA brochure, produced by Riksforbundet Svensk Tradgard
The post Carbon Cycle: A Complicated Illustration appeared first on Lizzie Harper.


